How to profit from support and resistance
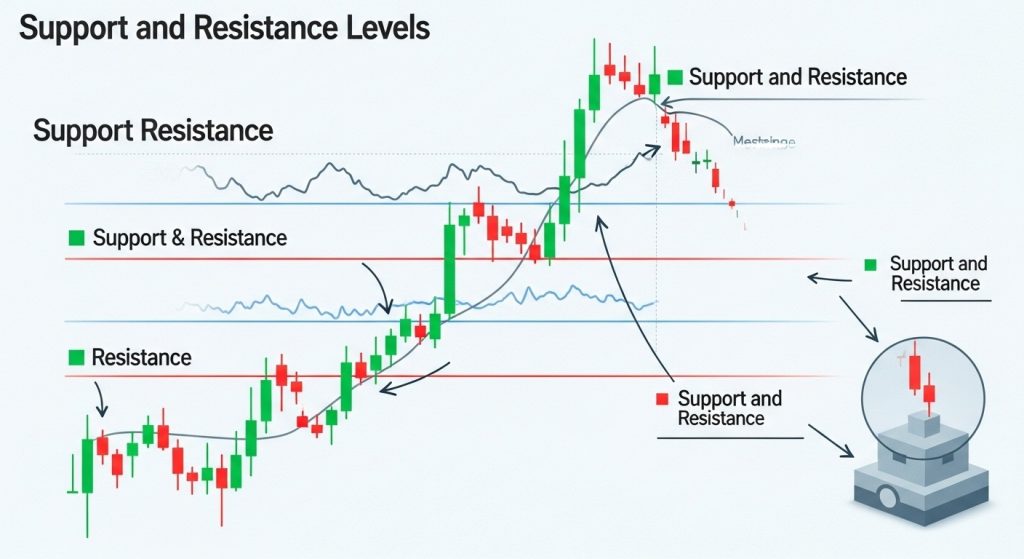 Support and resistance are pivotal concepts in technical analysis. Support represents a price floor where buyers step in, while resistance marks the ceiling where sellers dominate. Recognizing these zones enables traders to anticipate price reactions and structure profitable trades around key levels.
Pinpointing High-Probability Levels
Accurate identification of support and resistance starts with connecting swing lows and highs on clean charts. Multiple touches of a level without breach confirm its validity. Traders refine these zones by using candlestick wicks or clustering price bars, focusing on areas where price has repeatedly reversed.
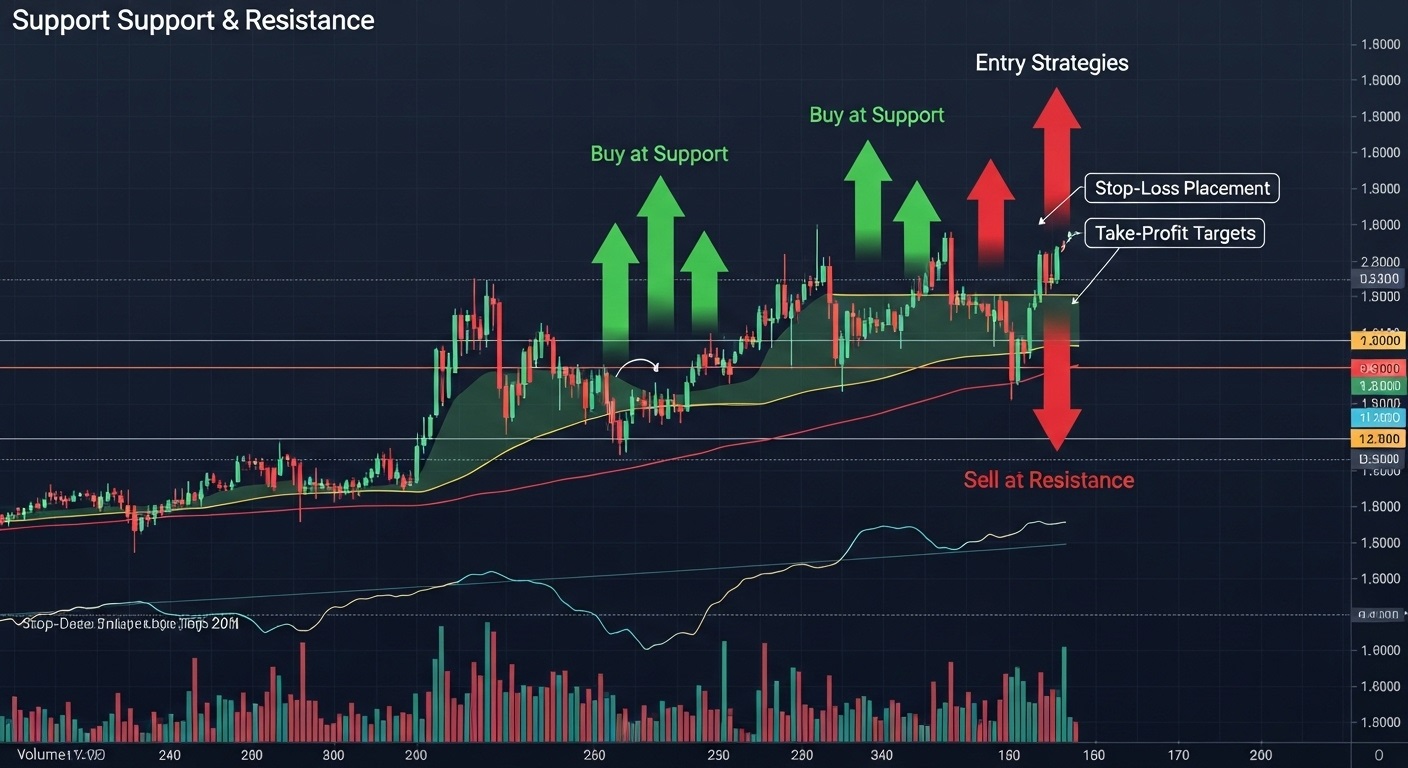
Crafting Entry Strategies at Support
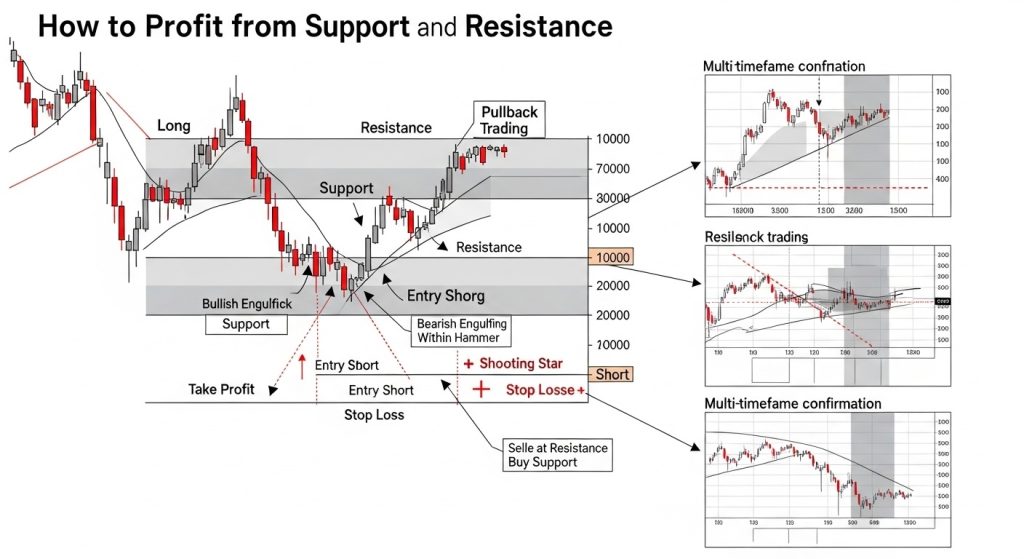
One common profit tactic is entering long positions at established support. When price retraces to a support zone and forms a bullish candlestick pattern—such as a hammer or engulfing bar—traders initiate buys. This strategy leverages the psychological shift from sellers to buyers, aiming to ride the ensuing rally.
Capturing Shorts at Resistance
Profiting on the downside involves selling near resistance. Traders wait for price to approach a resistance band and exhibit bearish signals like shooting stars or bearish engulfing patterns. Short entries just below this level capitalize on the shift from buying to selling pressure.
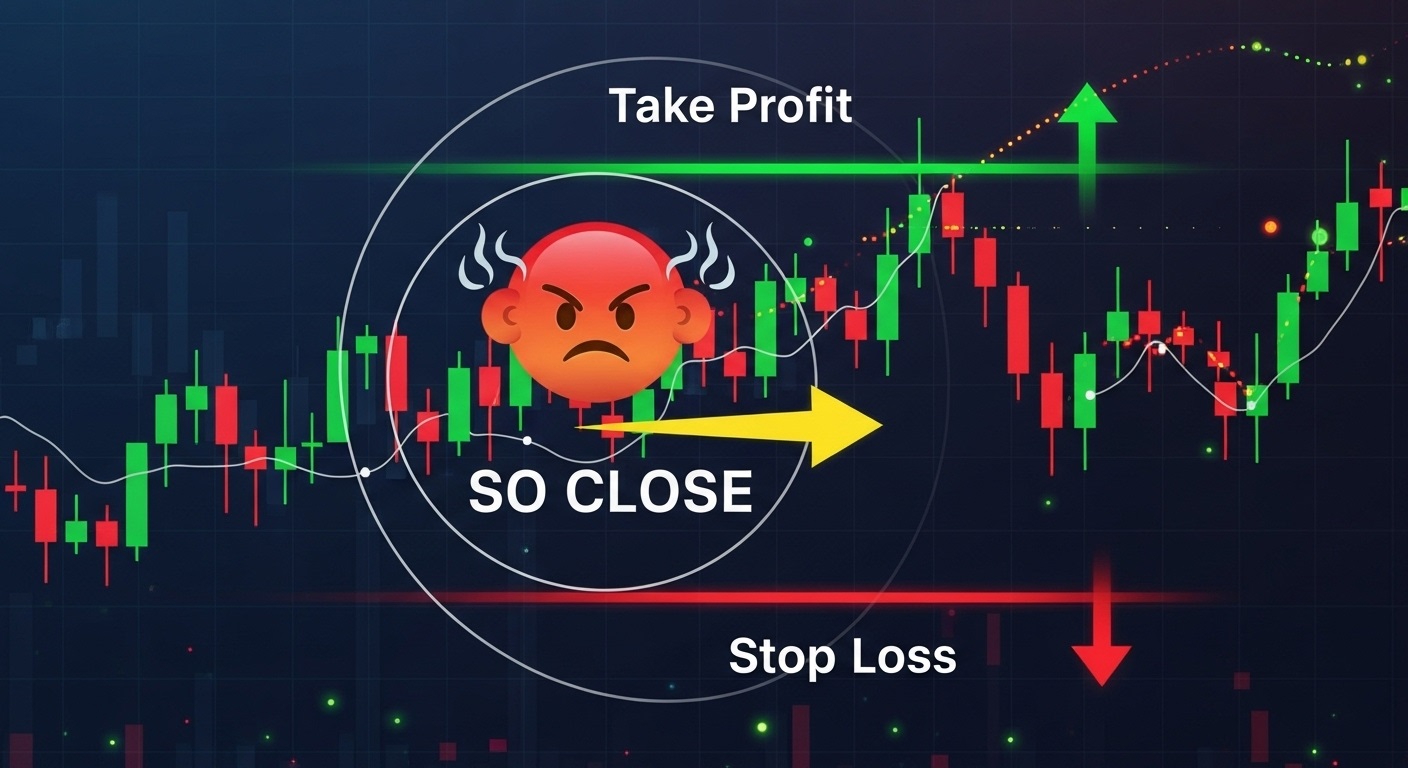
Strategic Stop-Loss Placement
Effective risk control hinges on stop-loss orders placed around support and resistance levels. For longs, stops sit slightly below support to allow normal volatility yet protect against deeper breakdowns. For shorts, stops rest just above resistance, reducing the risk of catastrophic losses from false breakouts.
Setting Take-Profit Targets
Aligning profit targets with opposing support and resistance zones maximizes reward-to-risk ratios. After entering a long at support, traders aim for the next resistance as their primary exit. Conversely, shorts target the next support level. Partial profit-taking along the way further secures gains.
 Breakout Trading for Momentum Moves
Breakout traders seek explosive moves beyond key levels. A close above resistance signals strong bullish momentum, prompting buy entries on pullbacks to the broken resistance, which may act as new support. Similarly, breakdowns below support encourage selling on retests of the breached zone.
Pullback Trading within Ranges
In ranging markets, price oscillates between support and resistance. Range traders profit by buying at support and selling at resistance repeatedly. Combining support and resistance with oscillators like RSI or Stochastic ensures entries occur when momentum aligns with the price zone.
Trend Confirmation and Level Alignment
Support and resistance strategies work best when aligned with the prevailing trend. In an uptrend, traders focus on buying at support within channel lines or trendlines. In downtrends, selling at resistance that aligns with moving averages or descending trendlines boosts probability of profitable reversals.
Multi-Timeframe Confirmation
Higher timeframe levels carry greater weight. Traders first mark key zones on daily or weekly charts, then fine-tune entries on lower timeframes. This approach filters noise and ensures trades occur at levels respected by longer-term market participants, increasing success rates.
Enhancing Profits with Confluence
Combining support and resistance with other technical tools creates confluence zones. A support area coinciding with a Fibonacci replacement, pivot point, or moving average crossover generates more reliable setups. Confluence enhances trader confidence and typically yields stronger price reactions.
Managing Risk and Psychology
To sustain profits from support and resistance, disciplined risk management and emotional control are essential. Traders should size positions relative to stop-loss distance, maintain win-loss records, and adhere to a trading plan. Regular review of trades ensures continuous learning and improved profitability.