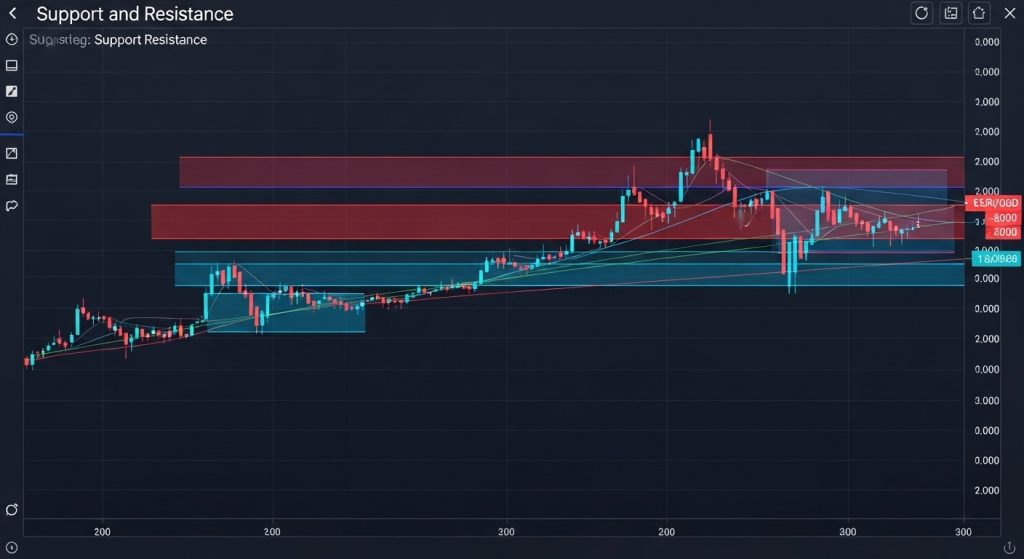
What Are Support and Resistance Levels?
 Support and resistance levels form the bedrock of technical analysis, offering traders a roadmap to identify potential turning points in price action. Support represents a floor where buying interest outweighs selling pressure, while resistance acts as a ceiling where sellers outnumber buyers.
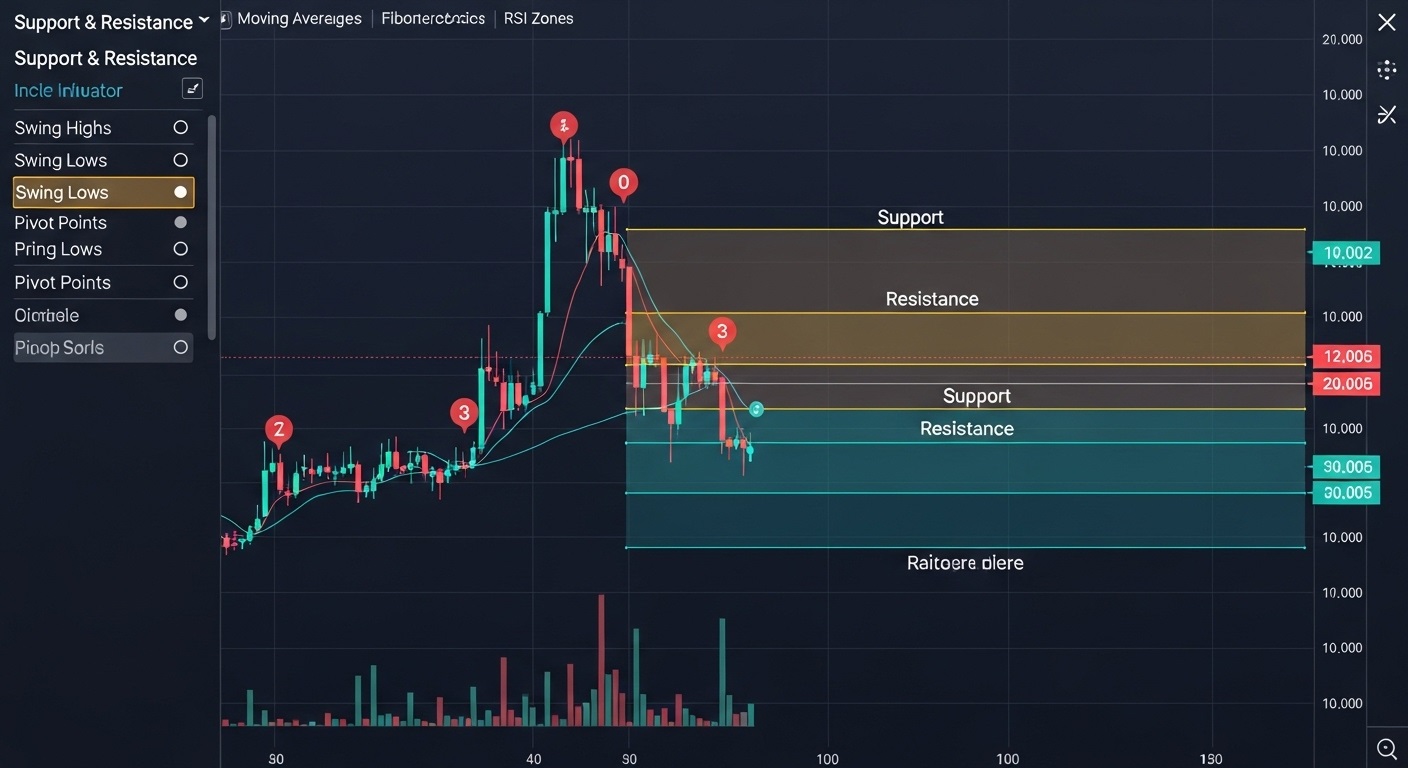
How the Indicator Automates Detection
A support and resistance indicator simplifies chart analysis by automatically detecting horizontal zones where price has historically bounced or stalled. It applies uniform algorithms—often based on swing highs, swing lows, or pivot points—to identify critical levels, reducing the guesswork and inconsistency of manual plotting.
Enhancing Objectivity in Your Analysis
Manual drawing techniques vary between traders, leading to subjective results. By contrast, the support and resistance indicator applies statistical precision to level detection. This objectivity strengthens strategy discipline, as every trader using the same settings will see identical support and resistance zones.
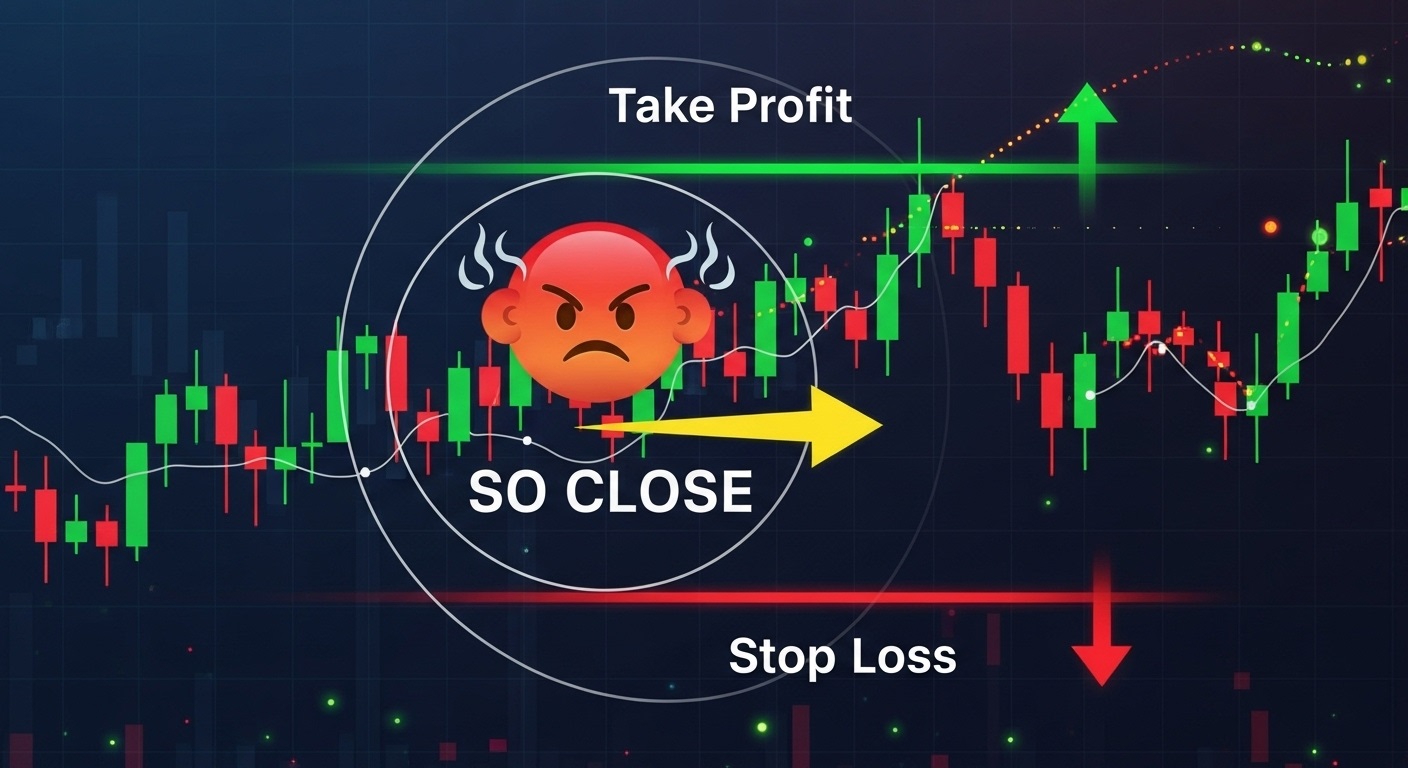
Integrating Risk Management
Incorporating support and resistance levels into risk management practices allows for precise stop-loss and profit-target placement. Placing a stop loss just beyond a support level minimizes downside when price breaks through, while targeting the next resistance maximizes reward-to-risk ratios.
 Multi-Timeframe Confirmation
The support and resistance indicator excels in multi-timeframe analysis. Day traders use intraday charts to spot quick reversals, whereas swing traders rely on daily and weekly charts to identify long-term trend floors and ceilings. Confirming levels across timeframes enhances signal reliability.
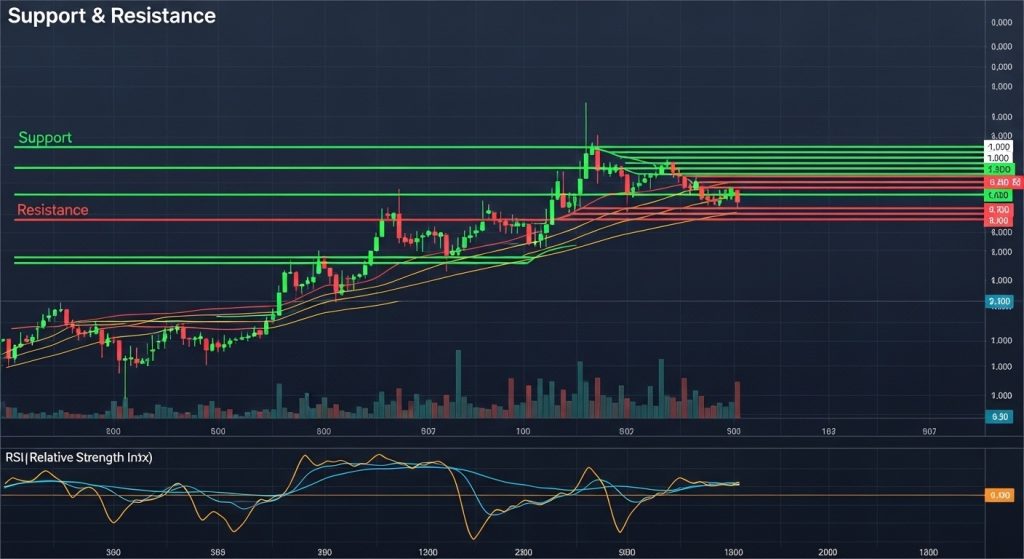
Confluence with Other Technical Tools
Combining the support and resistance indicator with moving averages, Fibonacci retracements, or RSI zones refines trade signals. A bounce off support that coincides with a rising moving average, for instance, offers a stronger long entry bias, while resistance aligned with an overbought RSI signals a potential sell.
Backtesting for Validation
Empirical testing of historical interactions between price and indicator-identified levels uncovers win rates and average returns. Backtesting helps optimize settings—such as swing-point sensitivity—and ensures the support and resistance indicator performs effectively in your chosen market, be it forex, equities, or crypto.
Real-Time Alerts and Efficiency
Modern trading platforms allow users to set alerts when price nears or breaches support and resistance levels. These real-time notifications free traders from constant chart monitoring, ensuring timely entries and exits without distraction.
Recognizing Indicator Limitations
Despite its strengths, the support and resistance indicator can produce false signals during high-volatility news events or sudden shifts in sentiment. False breakouts occur when price briefly pierces a level before reversing. Incorporating volume analysis or candlestick patterns helps filter genuine moves.
Building a Structured Trading Plan
To harness the indicator’s full potential, define clear rules for entries, stops, and targets relative to support and resistance zones. Maintain a trading journal that records how price reacts at each level. Continual review and adjustment of indicator parameters will improve accuracy over time.
Final Thoughts: Elevating Trading Performance
The support and resistance indicator offers a systematic, objective framework for identifying critical price levels. When used alongside complementary tools, validated through backtesting, and integrated into a disciplined plan, it can significantly enhance timing, risk management, and trader confidence.