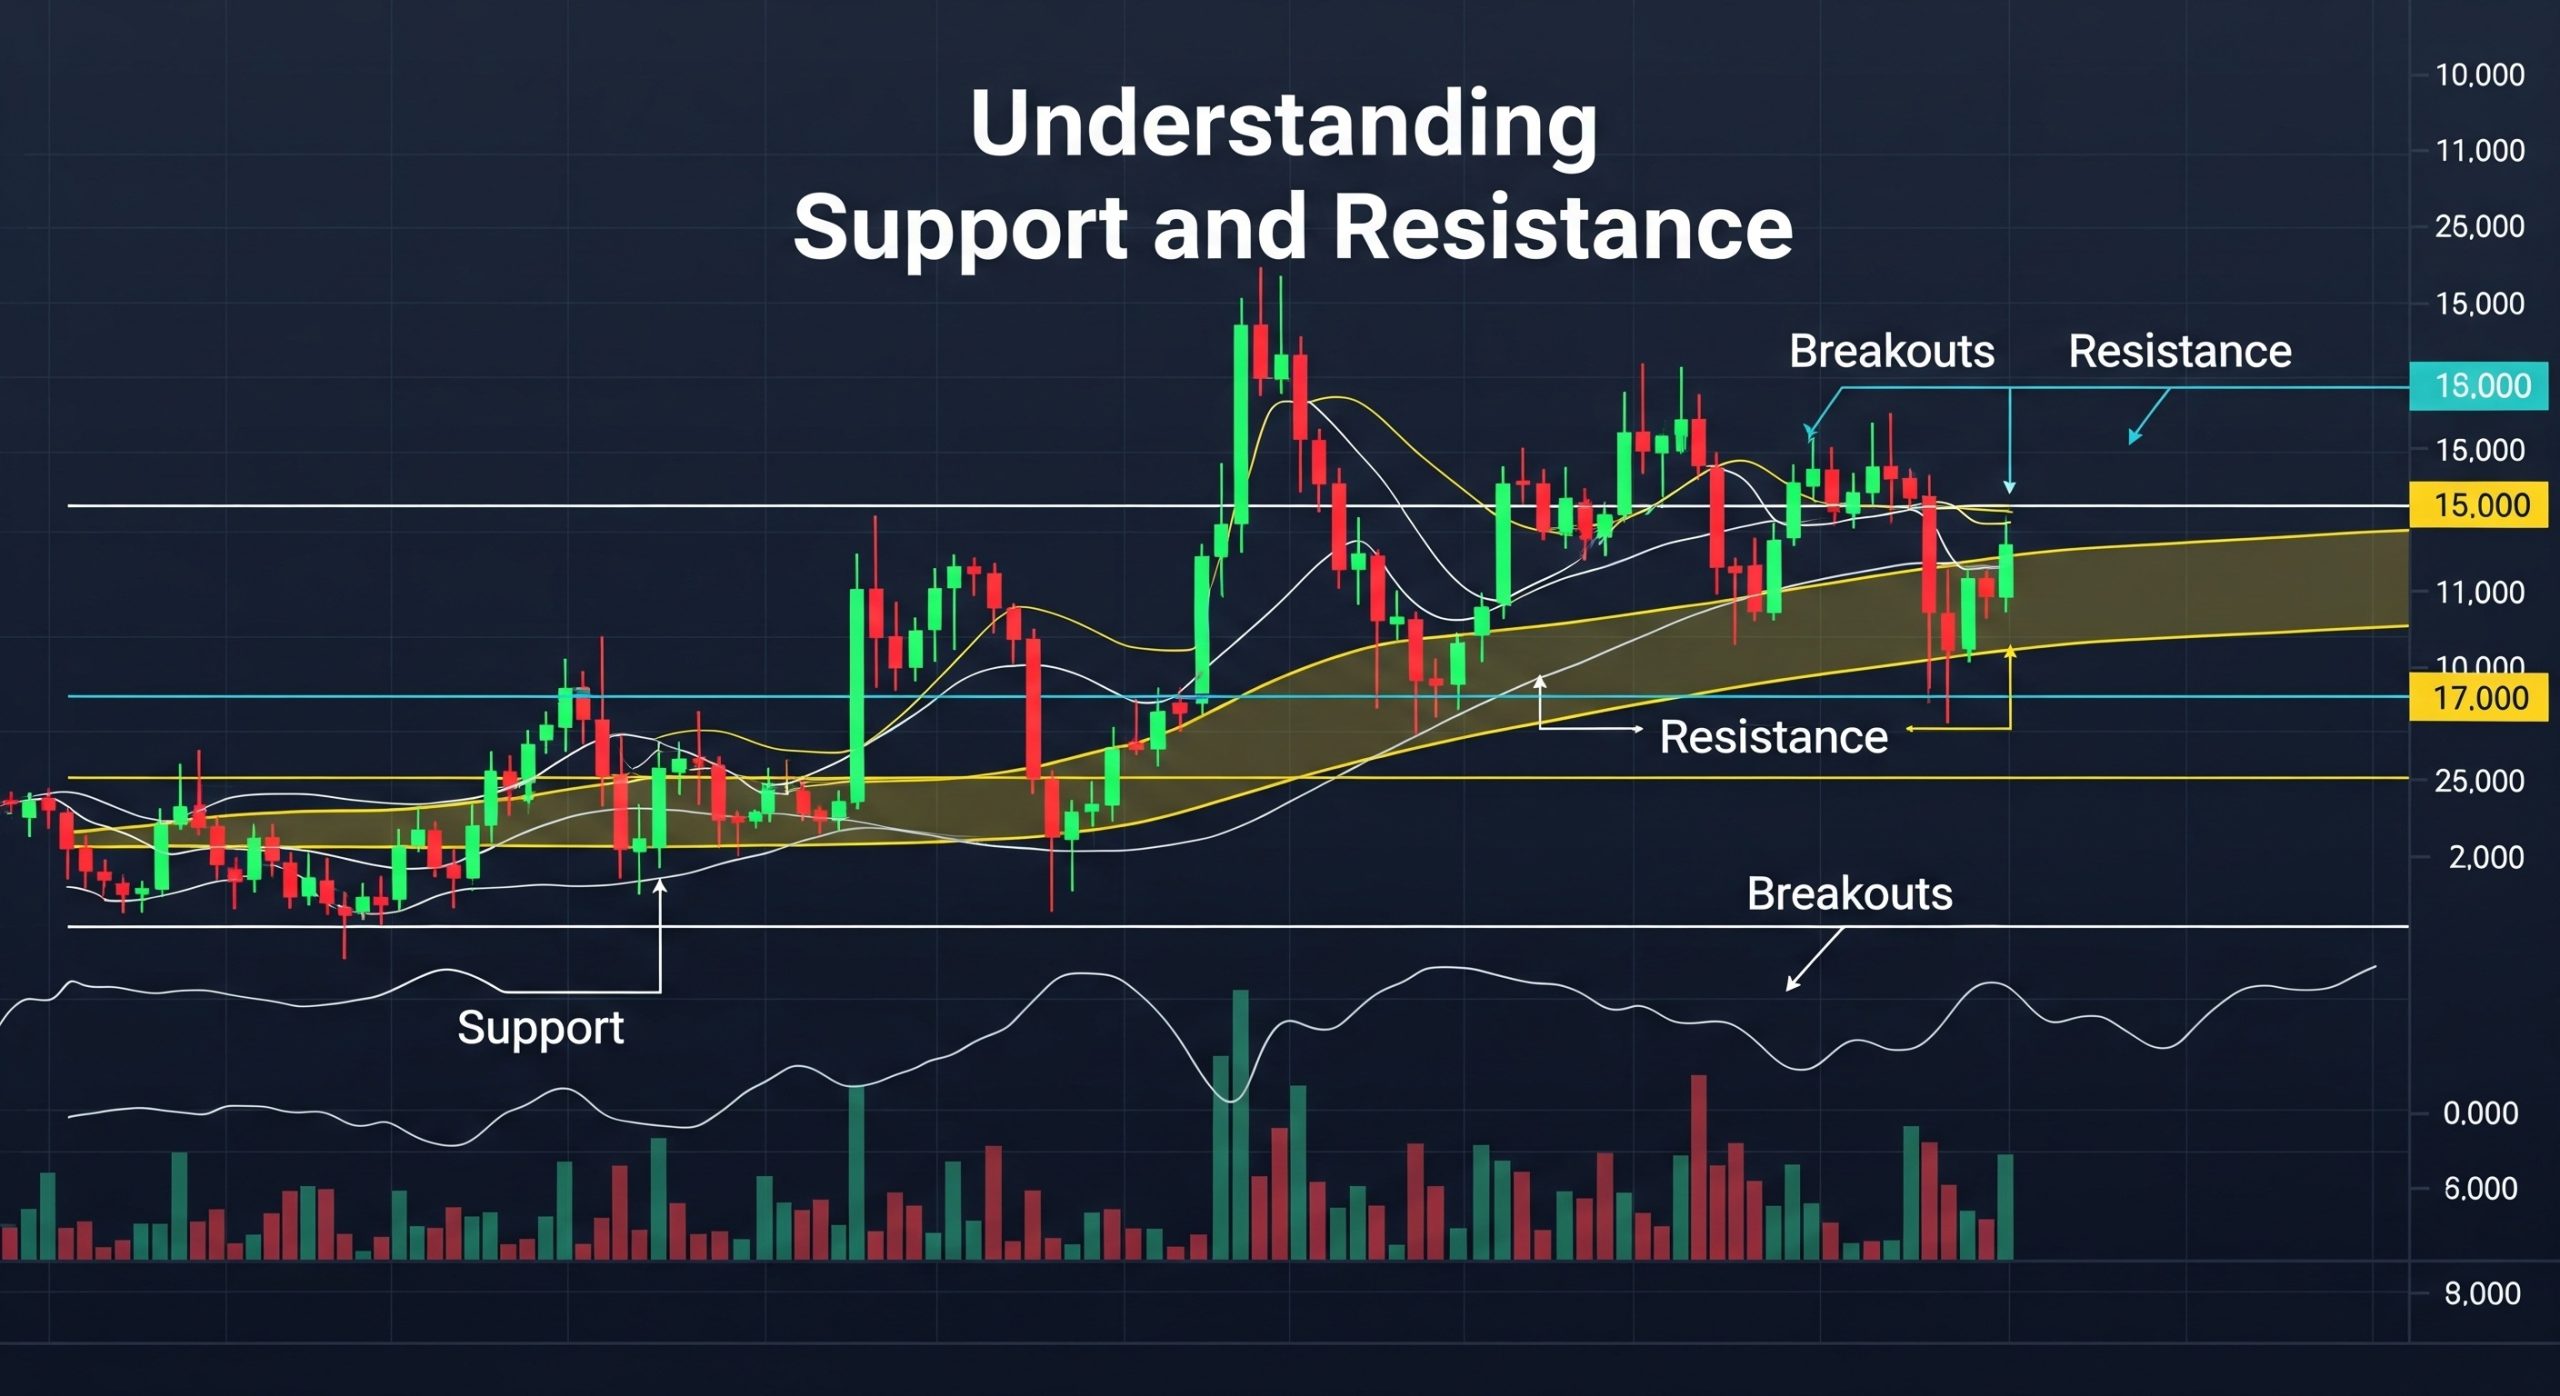
What is Support and Resistance
Support and Resistance are cornerstone concepts in technical analysis that help traders identify potential entry and exit points in the market. Support and Resistance refers to price levels where momentum tends to pause—support being a level where downward moves stall as buying interest emerges, and resistance being a level where upward moves falter due to selling pressure. Recognizing these zones enables traders to anticipate market reactions, set realistic price targets, and plan trades with greater confidence.
 Plotting and Confirmation Techniques
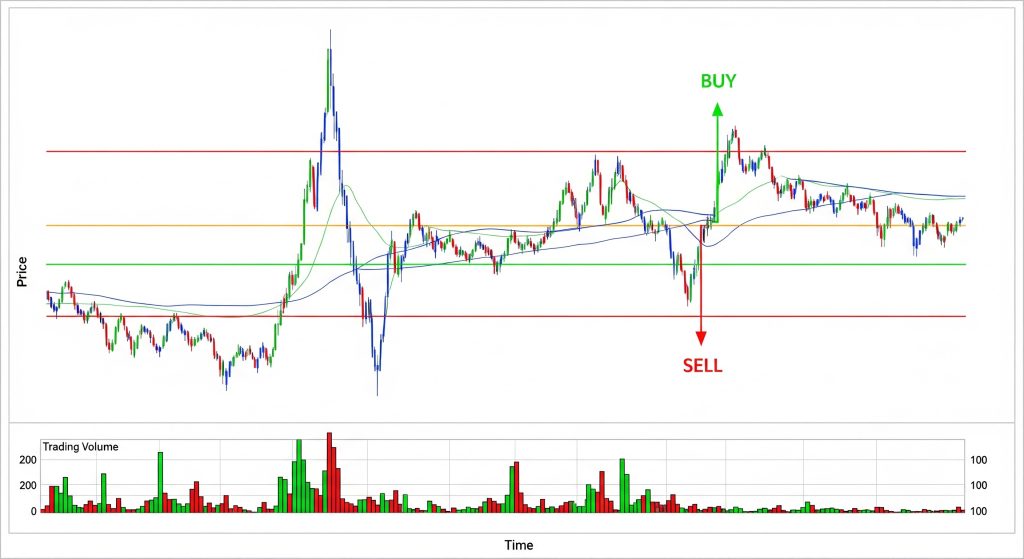
By plotting horizontal lines at historical support and resistance levels, traders can visualize areas where price has repeatedly reversed or consolidated. Combining Support and Resistance with indicators—such as moving averages, oscillators, or trendlines—enhances signal accuracy and filters out false breakouts. Monitoring volume at these levels is crucial, since a breakout with high volume often signals a sustained trend shift and confirms the validity of the level.
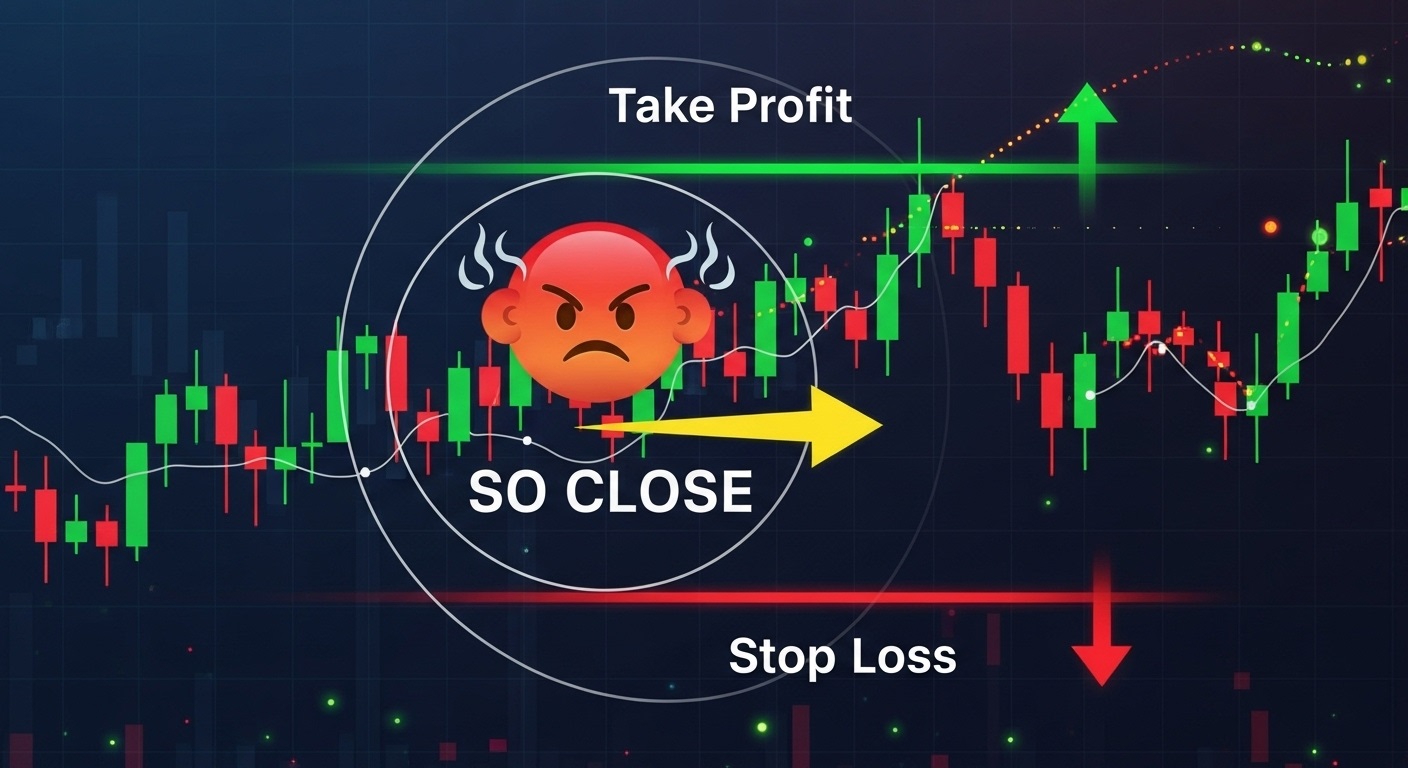
Practical Application and Risk Management
To effectively use Support and Resistance, adjust lines as new swing highs and lows develop, and avoid relying on a single timeframe. Higher time frames generally offer stronger support and resistance zones, while intraday charts capture finer entry and exit points. Mastering these concepts boosts risk management, as placing stop-loss orders just beyond key levels can protect against unexpected volatility and preserve trading capital.